Visualizing huge Neo4j Graphs with Gephi
Visualizing a huge graph with Neo4j Community Edition is painful, and it does not work with huge graphs. Neo4j Bloom is a great tool for dealing with such problems - indeed, it only has a problem: it is not free. A good alternative to Neo4j Bloom (included in Neo4j Enterprise Edition) is Gephi, a great visualization and exploration software that is also open-source and free. Here, we see how to set up Gephi and stream data from a Neo4j server.
Is Gephi obsolete? Yes, the software released its 0.9.2 version on September 24th, 2017 and since then not a lot has been made. A new visualization engine was under development, but right now it does not seem like a valuable alternative. Despite all this, Gephi is still a very powerful tool for huge graphs visualization, just enjoy it while it lasts!
Contents
- Introduction
- Initialize the dataset
- Setting Up Gephi
- Streaming Data from Neo4j
- Data Visualization
- References
Introduction
Excellent graph visualization is worth more than a thousand stats. Gephi is a great tool to create network visualizations, especially if pa APOC offers a handy procedure (apoc.gephi.add) that seamlessly streams network data from Neo4j to Gephi. Here, we will show how to stream data from a Neo4j graph database to Gephi and exploit the latter for visualization purposes.
Initialize the dataset
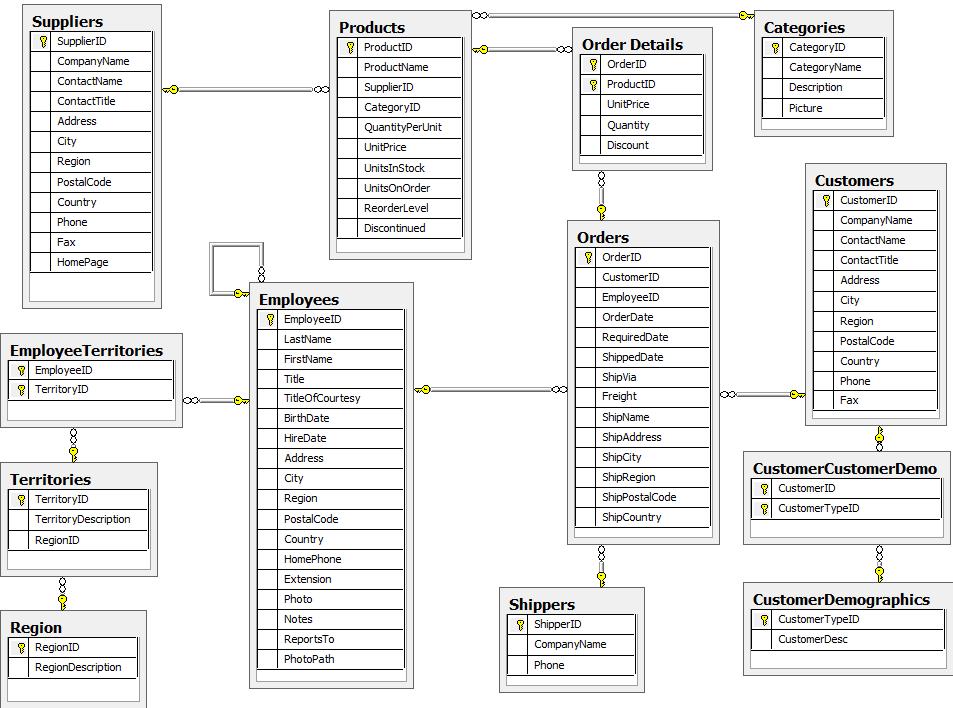
We will use a part of the Northwind Dataset (check out this article for more info), specifically, we will use the Order, Product, and Employee relationships:
We can import data from a CSV file in a remote location into Neo4j, so, we will initialize our graph database as follows (run the commands between the -- and --> lines):
-- Create "Order" nodes:
LOAD CSV WITH HEADERS FROM 'https://gist.githubusercontent.com/jexp/054bc6baf36604061bf407aa8cd08608/raw/8bdd36dfc88381995e6823ff3f419b5a0cb8ac4f/orders.csv' AS row
MERGE (order:Order {orderID: row.OrderID})
ON CREATE SET order.shipName = row.ShipName;
--> Added 830 labels, created 830 nodes, set 1660 properties, completed after 2298 ms.

-- Create "Employee" nodes:
LOAD CSV WITH HEADERS FROM 'https://gist.githubusercontent.com/jexp/054bc6baf36604061bf407aa8cd08608/raw/8bdd36dfc88381995e6823ff3f419b5a0cb8ac4f/employees.csv' AS row
MERGE (order:Employee {employeeID: row.EmployeeID})
    ON CREATE SET order.firstName = row.FirstName, order.lastName = row.LastName;
--> Added 9 labels, created 9 nodes, set 27 properties, completed after 474 ms.

-- Create "Product" nodes
LOAD CSV WITH HEADERS FROM 'https://gist.githubusercontent.com/jexp/054bc6baf36604061bf407aa8cd08608/raw/8bdd36dfc88381995e6823ff3f419b5a0cb8ac4f/products.csv' AS row
MERGE (product:Product {productID: row.ProductID})
    ON CREATE SET product.productName = row.ProductName, product.unitPrice = toFloat(row.UnitPrice);
--> Added 77 labels, created 77 nodes, set 231 properties, completed after 532 ms.

-- create "SOLD" relationships between orders and employees:
LOAD CSV WITH HEADERS FROM 'https://gist.githubusercontent.com/jexp/054bc6baf36604061bf407aa8cd08608/raw/8bdd36dfc88381995e6823ff3f419b5a0cb8ac4f/orders.csv' AS row
MATCH (order:Order {orderID: row.OrderID})
MATCH (employee:Employee {employeeID: row.EmployeeID})
MERGE (employee)-[:SOLD]->(order);
--> Created 830 relationships, completed after 1617 ms.

-- create "CONTAINS" relationships between orders and products
LOAD CSV WITH HEADERS FROM 'https://gist.githubusercontent.com/jexp/054bc6baf36604061bf407aa8cd08608/raw/8bdd36dfc88381995e6823ff3f419b5a0cb8ac4f/orders.csv' AS row
MATCH (order:Order {orderID: row.OrderID})
MATCH (product:Product {productID: row.ProductID})
MERGE (order)-[op:CONTAINS]->(product)
    ON CREATE SET op.unitPrice = toFloat(row.UnitPrice), op.quantity = toFloat(row.Quantity)
--> Set 4310 properties, created 2155 relationships, completed after 1188 ms.
Now, we can try to visualize our Graph via the Neo4j Browser:
MATCH (e:Employee)-[r1:SOLD]-(o:Order)-[r2:CONTAINS]-(p:Product) RETURN *
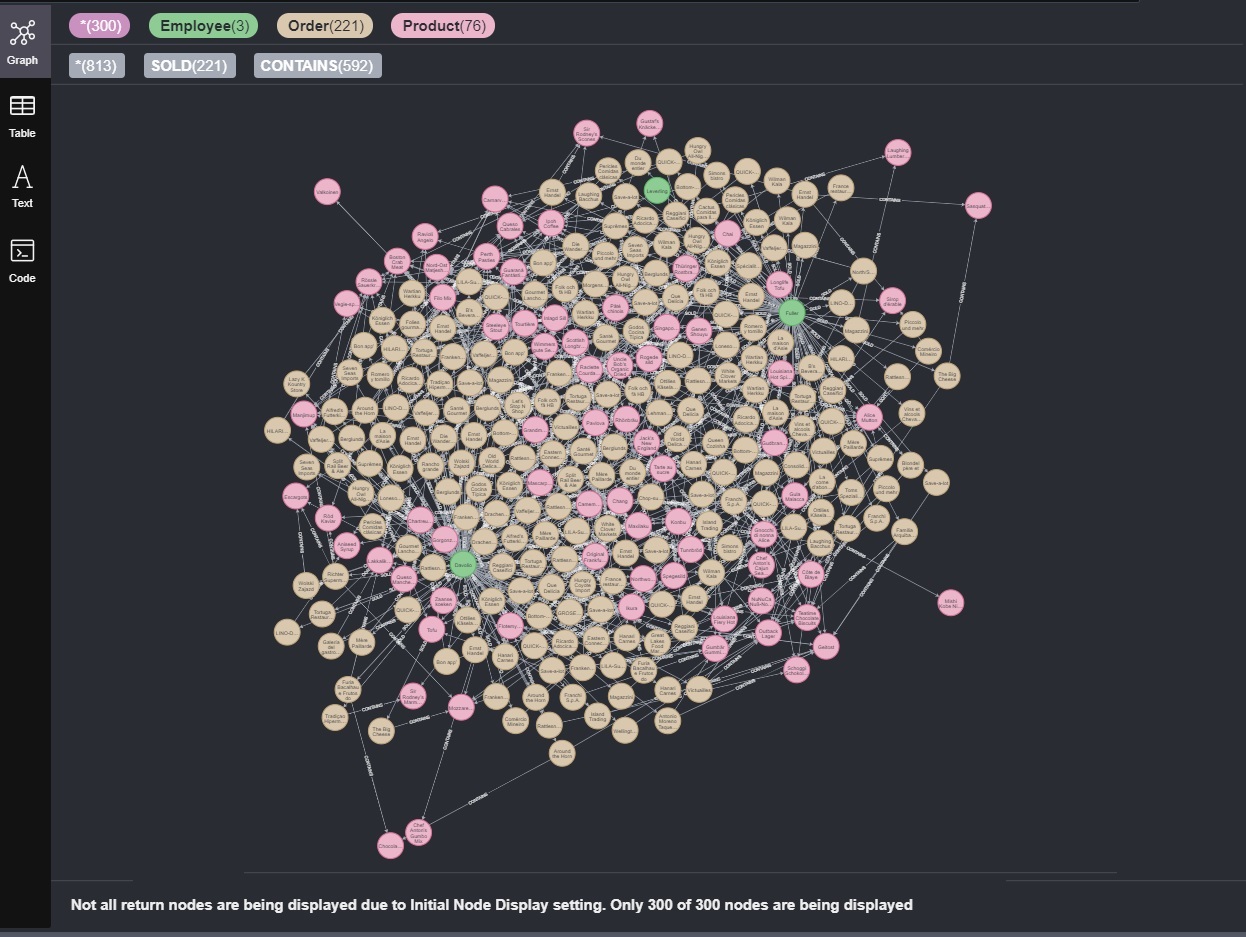
This is not pretty at all. Moreover, we are just visualizing 300 nodes out of the 916 total nodes! Here is where Gephi comes to rescue us.
Setting Up Gephi
After installing Gephi we need to install Gephi’s Graph Streaming plugin:
The purpose of the Graph Streaming API and Plugins is to build a unified framework for streaming graph objects. Gephi’s data structure and visualization engine have been built with the idea that a graph is not static and might change continuously. By connecting Gephi with external data sources, we leverage its power to visualize and monitor complex systems or enterprise data in real-time. Moreover, the idea of streaming graph data goes beyond Gephi, and a unified and standardized API could bring interoperability with other available tools for graph and network analysis, as they could start to interoperate with other tools in a distributed and cooperative fashion.
This is why Gephi is so powerful as a visualization tool! To install it, we can easily navigate Tools --> Plugins --> Available Plugins tab in Gephi, search for the graph streaming plugin and install it.
Now, we just have to create a new project with a workspace (let’s say, “Workspace 1”) and turn on the streaming server as shown below:
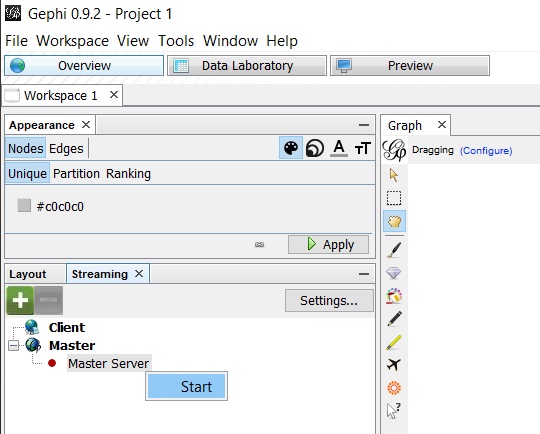
Now we’re ready to send nodes to Gephi from our Neo4j Browser to visualize them.
Streaming Data from Neo4j
Neo4j’s APOC library offers a handy procedure apoc.gephi.add that seamlessly streams network data from Neo4j to Gephi:
apoc.gephi.add(
    urlOrKey :: STRING?,
    workspace :: STRING?,
    data :: ANY?,
    weightproperty = null :: STRING?,
    exportproperties = [] :: LIST? OF STRING?
)
For example, we can stream our data as an unweighted undirected network (here we include an optional upper bound of 10000 nodes):
MATCH path = (:Employee)-[:SOLD]-(:Order)-[:CONTAINS]-(:Product)
WITH path LIMIT 10000
WITH collect(path) as paths
CALL apoc.gephi.add('http://gephimachine.local:8080','workspace1', paths) YIELD nodes, relationships, time
RETURN nodes, relationships, time
A well-known Gephi bug on Windows is triggered if some of the nodes streamed have accented characters such as
öorå. It gives a lot of trouble because It raises errors like the following one, interrupting the streaming:Failed to invoke procedure `apoc.gephi.add`: Caused by: com.fasterxml.jackson.core.JsonParseException: Invalid UTF-8 middle byte 0x74 at [ Source: (apoc.export.util.CountingInputStream); line: 2, column: 138 ]This, of course, does not happen when we work with a database without special characters.
To solve this problem, three solutions are available:
- Remove special characters from the data (like non-ASCII characters like
ä,Ä,ü,Ü,ö,Ö,ß)- Run Gephi on Linux inside a VM or Docker container
- Update Gephi to a newer version (if one is out, but that is unlikely)
I personally like the first one, so, we’re gonna clean our Neo4j graph database from all non-ASCII chars. The
apoc.text.cleanfunction is great for such a task.Using
apoc.map.mergewe only affect what is returned:MATCH (e:Employee) RETURN apoc.map.merge(properties(e), { firstName : apoc.text.clean(e.firstName), lastName : apoc.text.clean(e.lastName) }) --> Started streaming 9 records after 46 ms and completed after 144 ms. MATCH (o:Order) RETURN apoc.map.merge(properties(o), { shipName : apoc.text.clean(o.shipName) }) --> Started streaming 830 records after 34 ms and completed after 210 ms. MATCH (p:Product) RETURN apoc.map.merge(properties(p), { productName : apoc.text.clean(p.productName) }) --> Started streaming 77 records after 2 ms and completed after 4 ms.Using
SETwe actually modify the dataset:MATCH (e:Employee) SET e += { firstName : apoc.text.clean(e.firstName), lastName : apoc.text.clean(e.lastName) } --> Set 18 properties, completed after 318 ms. MATCH (o:Order) SET o += {shipName : apoc.text.clean(o.shipName)} --> Set 830 properties, completed after 50 ms. MATCH (p:Product) SET p += {productName : apoc.text.clean(p.productName)} --> Set 77 properties, completed after 4 ms.Now we should have solved our issue.
After running the apoc.gephi.add query, we should receive a table like the following one:
| nodes | relationships | time |
|---|---|---|
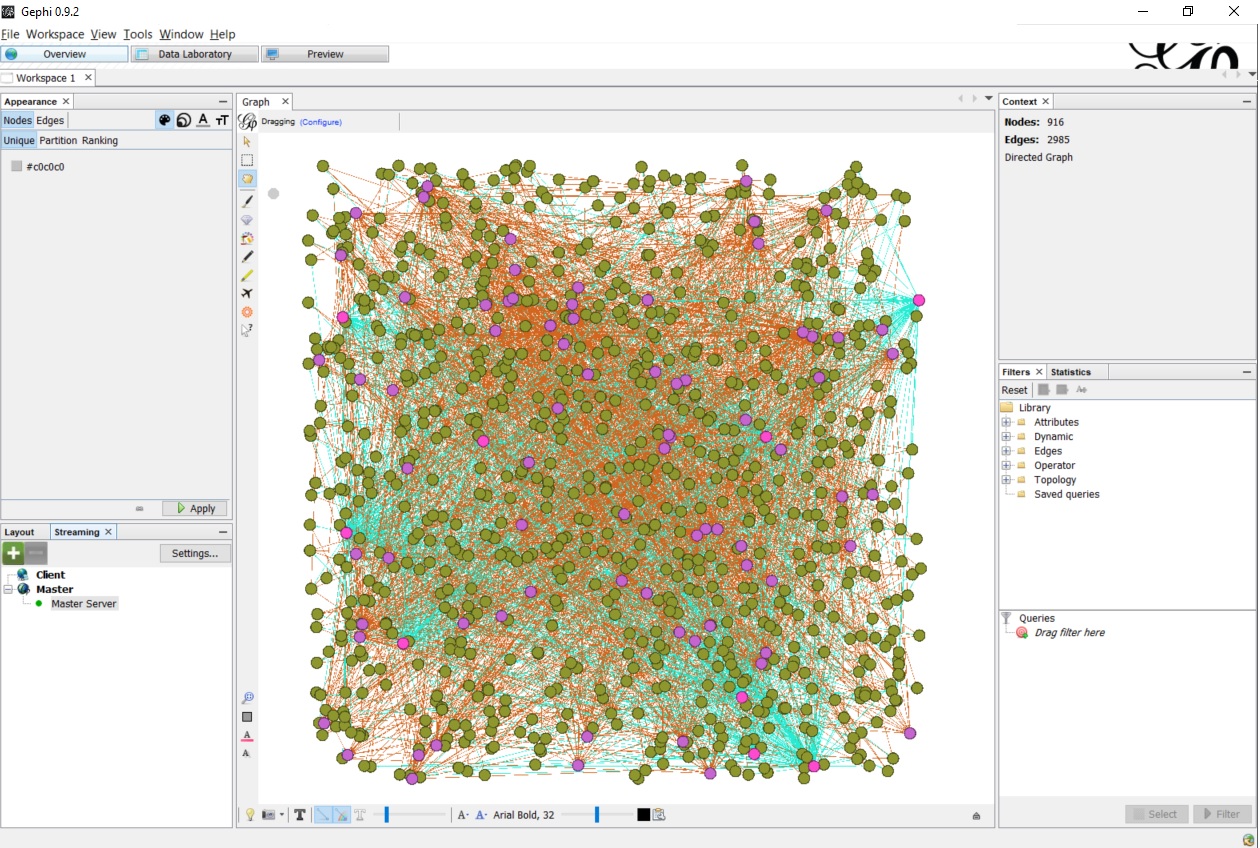
| 916 | 2985 | 345 |
In Gephi we should now finally see our data:
Data Visualization
Gephi offers lots of cool options, but it can have some learning curve because it has so many features and you can get lost when first using it. Using the Appearance tab, we can set color, size, label color, and label size based on some metrics. For instance, it is quite useful to link node size with the log of the node’s degree (in order to have high-degree nodes plotted as bigger nodes), and the same applies to text labels size. In the following video, we linked node and label sizes to the log-degree of the corresponding nodes, and then we applied the Fruchterman Reingold layout: